A few weeks back, we published our annual Writers in Tech Salary Survey Report where we explored research findings about UX writing and related professions.
We looked at data on global average income, compensation by age and experience, education levels, and more.
But our survey collected a lot more data than that!
We asked the community what other insights would interest them, and the first reply was for more info on gender. So in this article, we’ll dig deeper into the data and uncover a few more gender-focused insights.
In the original report, we presented two major insights about gender:
- Women dominate the field of writers in tech by a 3:1 ratio—close to 75% of respondents were women.
- Average and median global salaries for men and women were very close.
These insights showed us that writers in tech are helping close the gender wage gap, which is great! But if we dig a little deeper into the data, we see that there are still some differences between the sexes.
Note: most of the results in this report focus on men and women. This is because the various non-binary respondents were less than one percent making it difficult to find statistically significant results in most cases.
UX writing wage gap by country
As we said, on average, men and women around the world earn similar salaries as writers in tech. But we wondered, “are there any individual countries with significant differences?” Turns out that there are.
Figures are for full-time salaried employees and are in USD.
| Country | Gender | Median annual salary |
| Australia | Women | $77,160 |
| Men | $101,526 | |
| France | Women | $44,272 |
| Men | $55,340 | |
| Germany | Women | $55,340 |
| Men | $63,390 | |
| India | Women | $18,638 |
| Men | $24,348 | |
| Netherlands | Women | $62,377 |
| Men | $76,462 | |
| South Africa | Women | $29,541 |
| Men | $51,402 | |
| Spain | Women | $32,195 |
| Men | $42,256 | |
| United Kingdom | Women | $64,847 |
| Men | $59,492 |
Of the countries with a significant gap and enough responses for each gender, only in the U.K. did women report earning more than men.
We should note, though, that for a few of these countries, the sample size is small, so our results may not be as accurate in those cases. When we look at countries with larger numbers of respondents, like the US and Canada, or at the entire global set of responses, we see only a small gap between genders.
UX writing freelance rates by gender
Looking at freelance rates, we see a sharper distinction between men and women at the global level.
| Gender | Ave hourly rate |
| Women | $54 |
| Men | $66 |
Globally, on average, men are charging $12 more per hour than women, which is 22% more. Among countries with enough respondents to get meaningful data, Canada, France, Poland, and Spain had similar hourly freelance rates among men and women. But some countries had significant differences:
| Country | Gender | Ave hourly rate |
| Brazil | Women | $9 |
| Men | $16 | |
| India | Women | $40 |
| Men | $4 | |
| United States of America | Women | $68 |
| Men | $86 |
At first glance, it seems that women, in most countries, aren’t charging as much as men on freelance projects.
Again though, the picture isn’t as clear as it first seems to be.
When I dug a bit deeper, I saw that the average freelance rate for men was being skewed by a few very high outlier responses. If we removed those, the average hourly rate for men and women would be much closer.
India is an interesting case in that women are charging significantly more than men. I double-checked the data (examined each row), and it seems accurate. It’s also surprising since, when we looked at full-time positions, Indian men earned more. So if anyone has a guess as to why Indian women are charging more than Indian men but earning less in full-time positions, we’d all love to hear.
The takeaway from this data should be that, whoever you are, whatever gender, and in whichever country, make sure you’re charging your clients the rate you deserve. Don’t be shy—you’re worth it!
Education, experience, and seniority
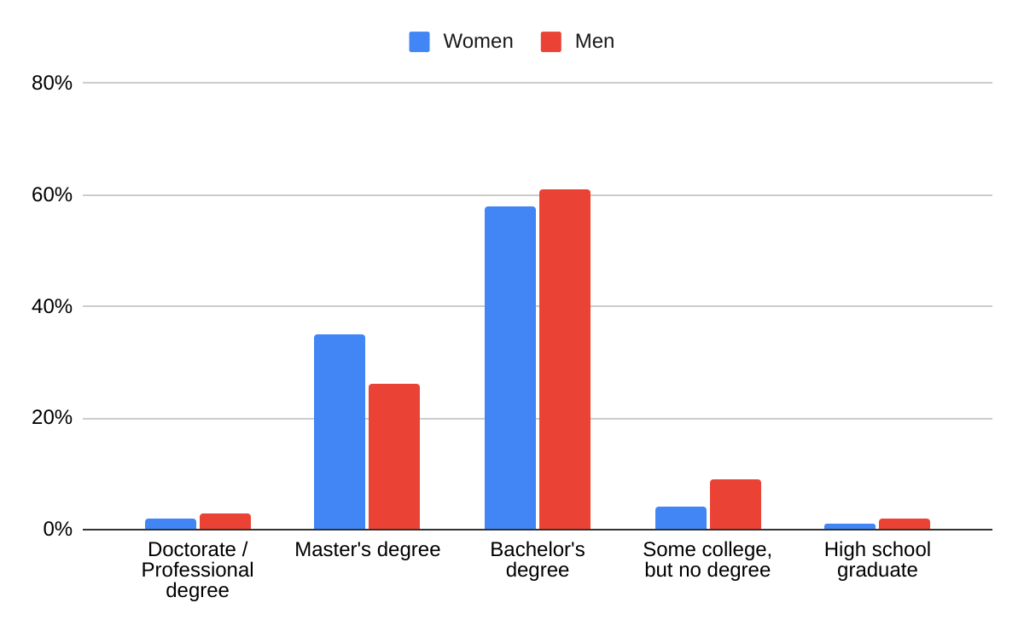
Among education levels, men and women were back on equal footing, with similar results for each level of education.
A larger percentage of women have master’s degrees, while more men didn’t finish college. But, as we saw in our initial report, these education levels don’t match up with salaries the way we would expect.
| Education level | % of female respondents |
| Doctorate / Professional degree | 2% |
| Master’s degree | 35% |
| Bachelor’s degree | 58% |
| Some college, but no degree | 4% |
| High school graduate | 1% |
| Education level | % of male respondents |
| Doctorate / Professional degree | 3% |
| Master’s degree | 26% |
| Bachelor’s degree | 61% |
| Some college, but no degree | 9% |
| High school graduate | 2% |

As for years of experience, men and women were mostly similar as well.
| Years of experience | % of female respondents |
| 0-2 | 30% |
| 3-5 | 31% |
| 5-10 | 24% |
| 10-20 | 14% |
| 30+ | 1% |
| Years of experience | % of male respondents |
| 0-2 | 23% |
| 3-5 | 38% |
| 5-10 | 25% |
| 10-20 | 11% |
| 30+ | 2% |
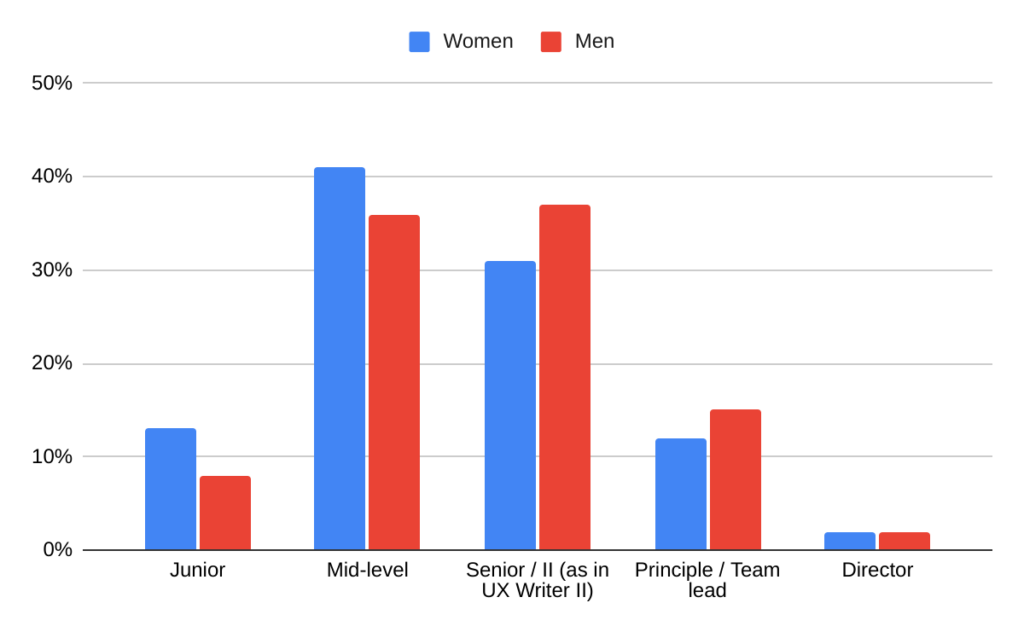
Yet when we look at seniority levels, we see a slight tendency for men to hold more senior positions. For example, though both 2% of men and women held director positions, a higher percentage of men held senior and team-lead positions, while a higher percentage of women held junior and mid-level positions.
| Seniority level | % of female respondents |
| Junior | 13% |
| Mid-level | 41% |
| Senior / II (as in UX Writer II) | 31% |
| Principle / Team lead | 12% |
| Director | 2% |
| Seniority level | % of male respondents |
| Junior | 8% |
| Mid-level | 36% |
| Senior / II (as in UX Writer II) | 37% |
| Principle / Team lead | 15% |
| Director | 2% |

Allow me a moment to clarify these seniority numbers.
These figures represent male and female responses separately. So, hypothetically and based on the data, if we looked at 400 writers, 8 of them would be directors. Of those 8, 6 would be women, and 2 would be men: a 3:1 ratio.
But if we looked at team leads in the same 400 writers, there would be 51 of them: 36 women and 15 men.
So while the ratio at the director level matches the general ratio, men are slightly overrepresented at the senior and team lead level.
Another way to look at the numbers is to consider the entire pool. If we look at the roughly 12,000 survey respondents, about 3,900 would be seniors. Of those, 2,790 would be women and 1,110 men: a 5:2 ratio.
This means that, though equality is generally high regarding education and experience among writers working in tech, there’s still room for improvement in seniority.
Salary negotiation and happiness
When it comes to striking a deal, the difference between genders is slight. 45% of both women and non-binary respondents negotiated their salaries, compared to 49% of men.
But who’s happier? Again, it’s about the same.
When asked if they were happy with their current income, on a scale of 1–5 (not at all – very much so), both men and women scored 3.6 on average. Non-binary and other respondents were a slight tick happier at 3.7.
At the office (home or otherwise)
On-site, hybrid, or remote? There was a slight difference.
76% of women reported working remotely, compared to 72% of men. Perhaps the mom factor explains the 4% difference.
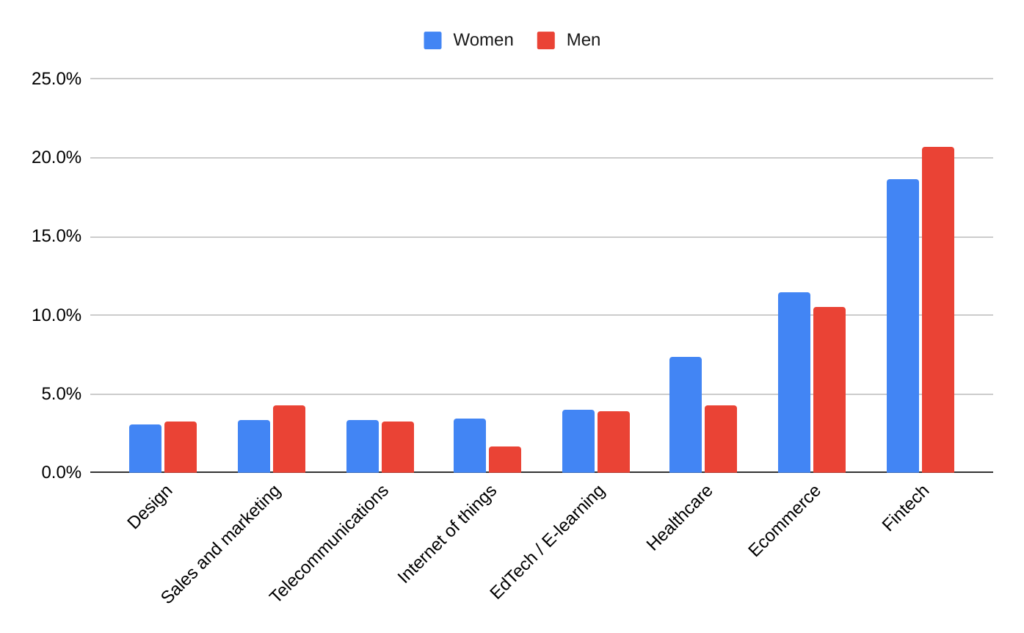
And what about industry? Do men and women have different preferences when it comes to working in fintech vs. edtech?
Fintech was the top industry for both, with 21% of men and 19% of women working in that field. E-commerce was the second most popular for both as well. Of the most popular industries for UX and other writers in tech, only in healthcare did we see a significant difference, with 7% of women and 4% of men choosing that industry.

Otherwise, there are no significant differences in gender when it comes to which industries writers in tech work in.
Finally, we asked respondents if they feel like they have a say in product design decisions. On a scale of 1–5 (not at all – very much so), men and women responded similarly, but still with a statistically significant difference.
The average score for women was 3.20, while for men, it was 3.44. So men report having a higher chance of having a seat at the proverbial product team table.
That about wraps up our UX writing and writers in tech gender report. And be sure to check out the next article in the series: UX Writers and Designers in the Workplace. Any questions or comments about the findings? Let us know.
Further reading
UX Writing Salaries in 2022: Survey Report


